| Summary | Metrics and Stats to Prometheus / Grafana | |
| Repository | https://codeberg.org/surging9143/stashapp-prometheus-exporter |
I see there has been quite a few attempts at stats / dashboard plugins, but none really fit what i wanted. So might aswell add it into my current monitoring stack.
The beauty of having this in Prometheus / Grafana is that you can really build whatever you want and derive statistics however you want.
For me, like 80% of the fun of stash comes from organization, and metrics is just more ways to organize and visualize that data.
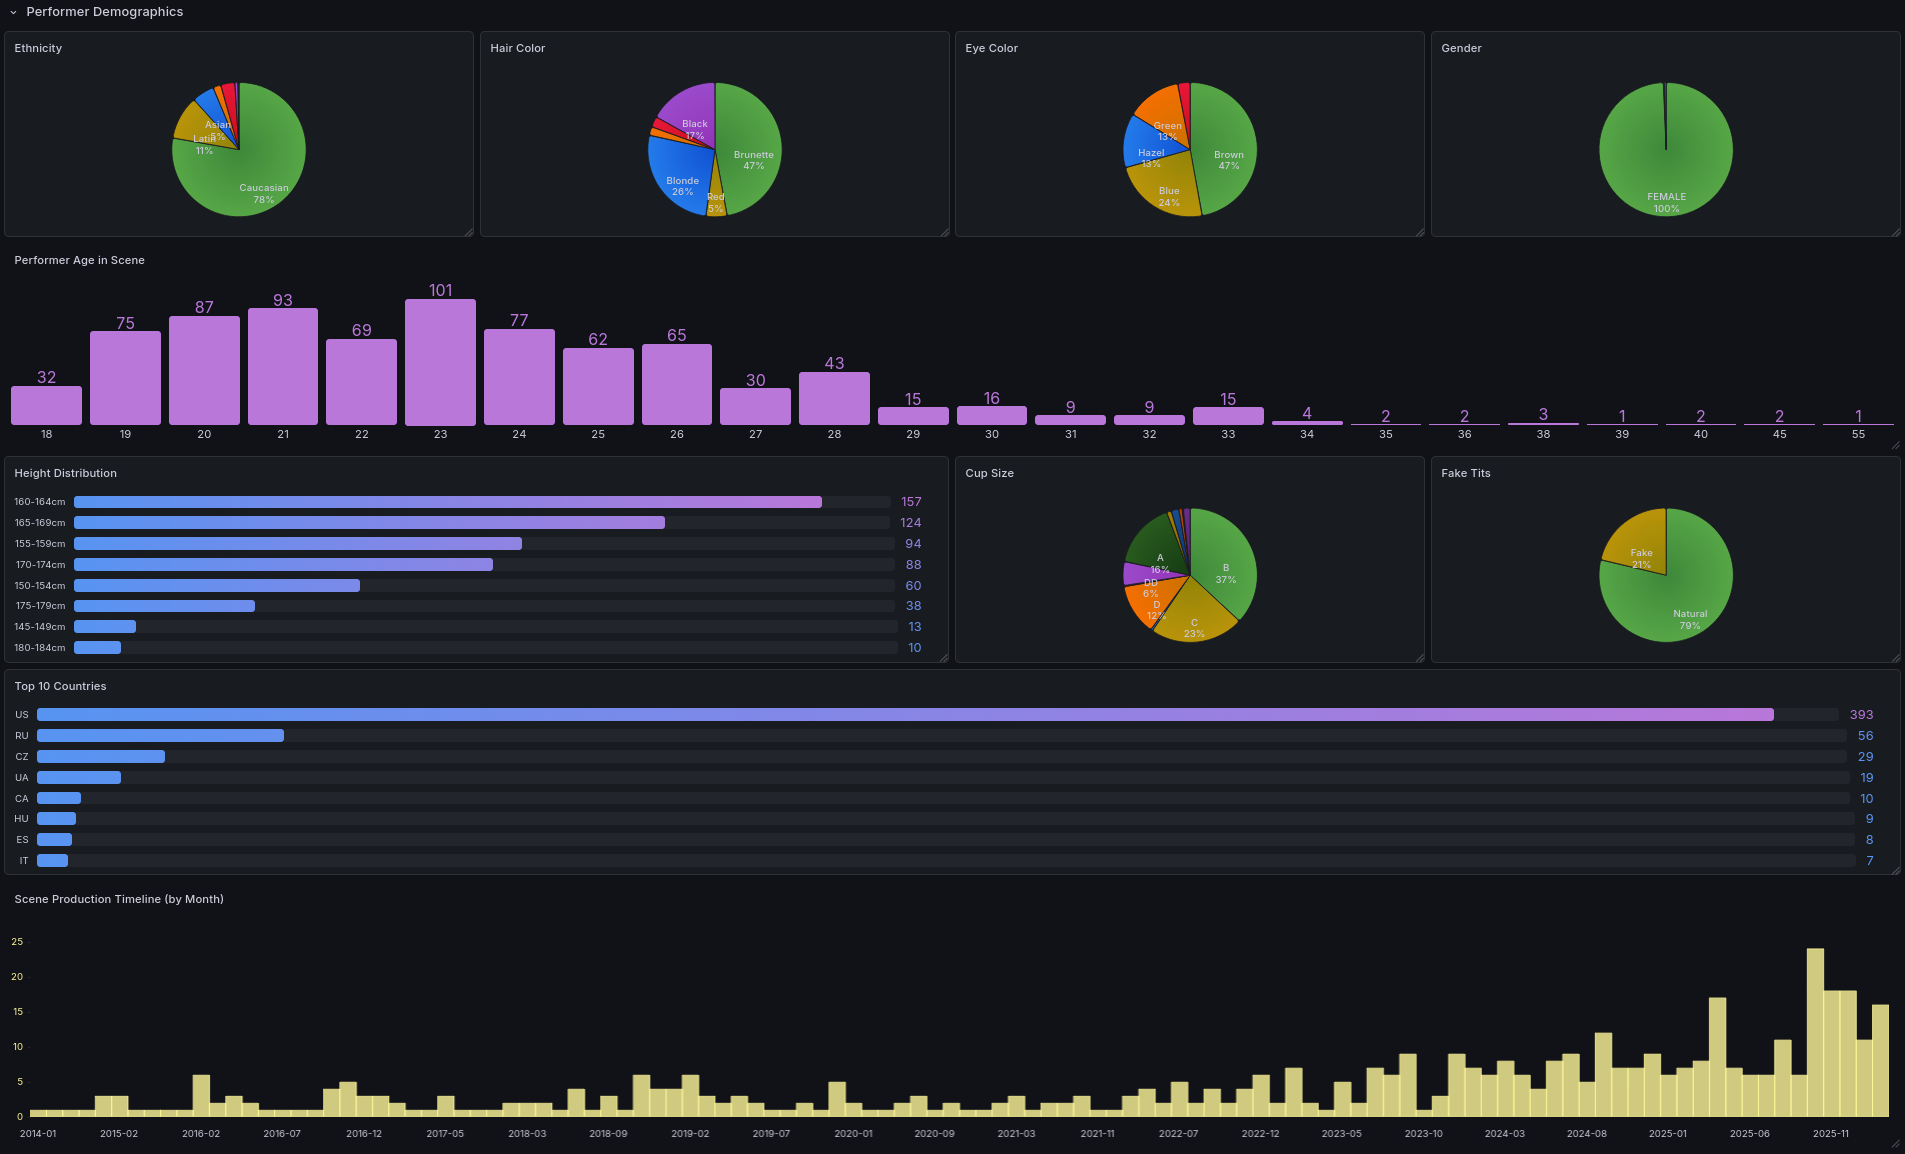
This Queries your Stash instance and exposes metrics like total scenes, images, performers, watch time, and play patterns (by day of week and hour of day) on /metrics for Prometheus to scrape. aswell as much more.
Suggestions on what metrics to scrape is welcome!
See dashboards/stashapp-overview.json for a Grafana dashboard example.
Check out the github readme for a more complete overview.